
Trade With a Defined Entry, Exit & Risk Management Framework
WD Gann + Option Chain Analysis — Simplified Into a Practical Intraday Trading Strategy
Stop relying only on guesswork and random entries. Our WD Gann Intraday Trading Strategy combines WD Gann levels with option-chain based market information to identify structured trading opportunities across index and selected stocks.
Why Do Traders Struggle With Intraday Trading?
Most intraday traders do not fail because they lack passion—they struggle because they trade on emotional impulse without a disciplined, rule-based framework.
Wrong Entry
Entering too early out of FOMO or entering too late on extended candles completely damages the risk-reward ratio of your trade setup.
Confusing Exit
Traders often struggle to identify when to book profits or exit a losing position, cutting winning trades too soon while letting losers run.
No Clear Stop Loss
Without a predefined mathematical risk level, emotions take over during volatility, leading to devastating hope-based holding.
Too Much Information
Watching dozens of conflicting indicators, telegram tips, news flashes, and raw option tables creates analysis paralysis rather than actionable clarity.
Everything You Need — Inside One Structured Strategy
The objective is to simplify the decision-making process by combining multiple mathematical and market inputs into a single structured workflow.
By mapping geometric price levels directly against institutional Open Interest, traders gain a clear mathematical perspective before taking any market exposure.
How The Strategy Works
A systematic 5-step roadmap engineered to eliminate emotional bias and structure every trade setup with mathematical precision.
Identify the Zone
The strategy identifies important WD Gann price zones that help traders immediately understand whether the current market environment favors bullish or bearish trades.
Read Option Chain
Use relevant option-chain data to understand market positioning, Call/Put Open Interest concentration, and potential directional opportunities.
Generate Trade Direction
When price respects the zones and option data aligns:
BULLISH ZONE → CALL SETUP
BEARISH ZONE → PUT SETUP
*Example framework — actual execution follows rule conditions.
Defined Stop Loss
A predefined stop-loss framework helps control downside risk so you know your exact risk exposure before the order is triggered.
Target Framework
The strategy includes predefined multi-target logic so traders do not have to rely on guesswork or panic while securing profits.
Visualizing Bullish & Bearish Strategic Zones
Clear visual boundaries simplify complex market action into structured, actionable intraday areas.
Above Zone = Bullish Area
Market structure is interpreted through the strategy framework to identify potential bullish opportunities with call options and long equity setups.
| Indicator | Value | Status |
|---|---|---|
| ADX | 60.71 | Trending |
| RSI | 92.57 | Bullish |
| SuperTrend | 2996.32 | Bullish |
| VWAP | 3007.65 | Bullish |
| MACD | +8.38 | Bullish |
LEVEL
Below Zone = Bearish Area
Market structure is interpreted through the strategy framework to identify potential bearish opportunities with put options and short scalping setups.
| Indicator | Value | Status |
|---|---|---|
| ADX | 52.29 | Trending |
| RSI | 11.21 | Bearish |
| SuperTrend | 1109.38 | Bearish |
| VWAP | 1109.59 | Bearish |
| MACD | -11.72 | Bearish |
Why Combine WD Gann With Option Chain Analysis?
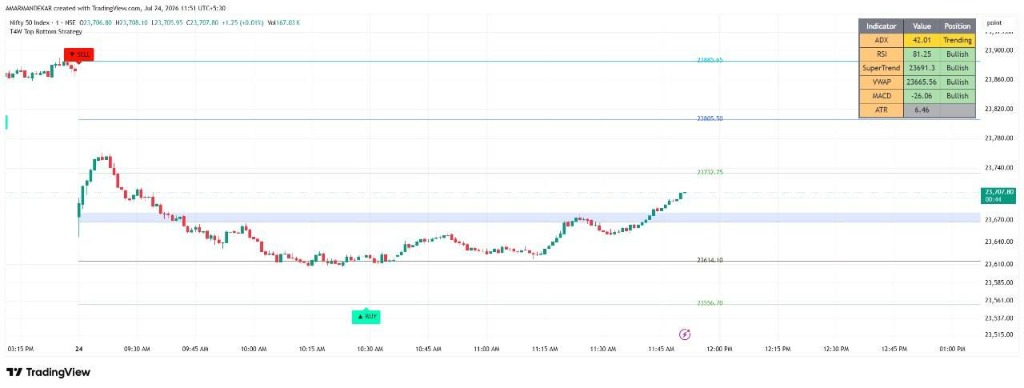
Price levels tell you WHERE to look. Option chain data tells you WHAT institutional market participants are doing. Combining both creates actionable market clarity.
WD Gann Analysis
Option Chain Analysis
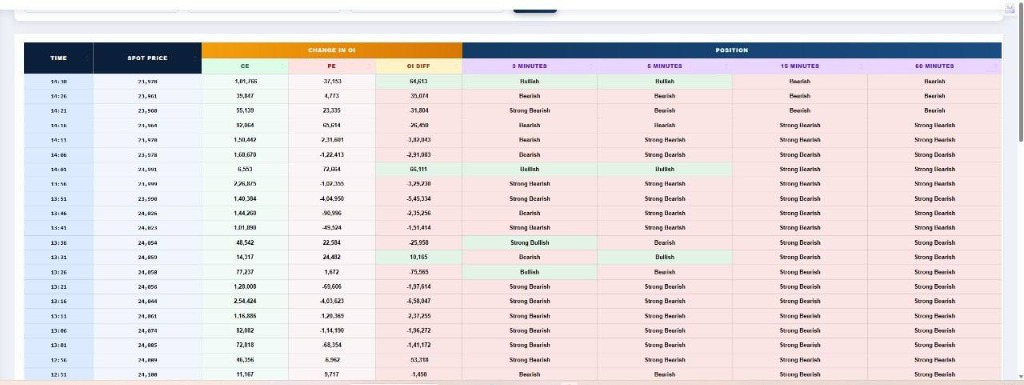
Live Option Chain & Trade Data Sheet Interface
Real-time analytical interface demonstrating how change in open interest, volume shifts, and algorithmic Brahmastra stock filtering converge inside our trading strategy workspace.
| TIME | CHANGE IN OI | CHANGE IN OI % | SPOT PRICE | POSITION | |||
|---|---|---|---|---|---|---|---|
| CE | PE | OI DIFF | CE % | PE % | |||
| 09:59 | ▲ 8,10,52,985 | ▲ 4,40,49,460 | ▼ -3,70,03,525 | +1.19% | +0.01% | 24,018 | |
| 09:56 | ▲ 8,00,98,005 | ▲ 4,40,45,170 | ▼ -3,60,52,835 | +4.27% | -3.2% | 24,016 | |
| 09:55 | ▲ 7,68,15,635 | ▲ 4,55,00,910 | ▼ -3,13,14,725 | +1.99% | +1.11% | 24,026 | |
| 09:52 | ▲ 7,38,70,420 | ▲ 4,50,00,605 | ▼ -2,88,69,815 | +10.18% | -3.45% | 24,027 | |
| 09:49 | ▲ 6,70,45,810 | ▲ 4,66,09,030 | ▼ -2,04,36,780 | +12.06% | -12.72% | 24,021 | PUT BUY |
| 09:46 | ▲ 5,98,29,185 | ▲ 5,11,99,450 | ▼ -86,29,715 | +14.74% | -12.31% | 24,022 | PUT BUY |
| 09:41 | ▲ 5,21,44,715 | ▲ 6,08,95,705 | ▲ 87,50,990 | +15.51% | +1.64% | 24,035 | |
| 09:38 | ▲ 4,51,41,135 | ▲ 5,99,15,700 | ▲ 1,47,74,565 | +10.93% | +0.09% | 24,039 | |
| 09:37 | ▲ 4,06,95,055 | ▲ 5,98,60,775 | ▲ 1,91,65,720 | +2.01% | +7.1% | 24,046 | |
| 09:34 | ▲ 3,98,92,450 | ▲ 5,58,75,300 | ▲ 1,59,82,850 | +10.3% | -11.73% | 24,066 | |
| 09:31 | ▲ 3,61,67,560 | ▲ 5,00,10,740 | ▲ 1,38,43,180 | -5.9% | +9.68% | 24,063 | |
Brahmastra Stock Scanner
Our scanner-style framework is designed to help identify stocks showing potentially significant trading opportunities according to predefined strategy conditions. It filters noise and spotlights stocks nearing crucial Gann levels and option build-up.
Built To Make Trading Decisions Simpler
Every component of the WD Gann Intraday Strategy is structured to remove ambiguity and build objective execution habits.
WD Gann Based Levels
Accurate mathematical price levels calculated in advance for key support and resistance zones.
Bullish & Bearish Zones
Clearly defined boundary areas that classify the intraday environment without subjective bias.
Option Chain Analysis
Real-time Open Interest confirmation to identify institutional participation behind moves.
Defined Entry Framework
Objective entry conditions that instruct you exactly when to enter with confidence.
Defined Stop Loss
Predefined risk containment to protect trading capital and prevent emotional holding.
Target-Based Approach
Logical profit booking levels so you do not exit prematurely or surrender gains.
Brahmastra Stock Scanner
Systematic screening criteria to scan trending stocks meeting strategy conditions.
Easy-to-Follow Workflow
A structured routine designed to fit cleanly into your daily market schedule.
Who Is This Strategy For?
Whether you are taking your first structured steps or seeking to refine existing systems, this rule-based framework adapts to your goals.
For Beginners
Traders looking for a structured, mathematical way to understand intraday setups without drowning in complex indicators or falling victim to random tips.
For Experienced Traders
Traders who already understand price action but want an additional high-probability Gann and Option Chain confluence framework to validate setups and tighten stop losses.
For Busy Traders
Working professionals who prefer a simplified, high-efficiency workflow instead of spending hours staring at flickering charts across 10 screens.
What Traders Are Saying
Real experiences shared by academy students who transformed their trading mindset through our structured framework.
Real Client Feedback & Strategy Setups
Authentic chart analysis, student reviews, and pattern recognition setups directly from the Trade4Wealth community. Click any screenshot to expand.

Get Access to the WD Gann Intraday Trading Strategy
Fill in your details below to register your interest and receive complete strategy information.
Frequently Asked Questions
Everything you need to know about the WD Gann Intraday Trading Strategy framework, prerequisites, and learning process.
The WD Gann Intraday Trading Strategy is a rule-based educational methodology that calculates mathematical price zones derived from W.D. Gann principles, coupled with Option Chain Open Interest data. It provides predefined parameters for market direction, entries, stop loss, and profit targets.
Gann levels pinpoint critical mathematical support and resistance price points where reversals or breakouts frequently develop. Option Chain analysis confirms whether institutional volume and Call/Put Open Interest are actively validating those zones, creating a powerful confluence before taking a trade.
Yes. Mentor Amar Mandekar's engineering teaching background enables him to teach the strategy step-by-step without requiring prior advanced options knowledge. The framework is structured to keep trade decisions straightforward and objective.
While the strategy is primarily used on liquid indices like Nifty 50 and Bank Nifty, its geometric principles and scanner framework can be applied to high-liquidity equities, stock options, and commodities.
Yes. A primary rule of this system is that every setup requires predefined mathematical entry points and an exact stop-loss level before taking execution, ensuring your capital is protected at all times.
Yes. The framework provides structured multi-target calculations based on Gann mathematical ratios so traders can book profits objectively rather than exiting out of anxiety or greed.
No. The entire goal of this strategy is to eliminate cluttered charts and conflicting indicators. By concentrating only on the Gann price zones and Option Chain positioning, you operate from a clean, unified workspace.
No. Trading in financial markets and derivatives involves market risk, and no strategy can guarantee profits. The strategy is intended strictly as an educational and decision-support framework. Traders should manage their risk, follow position sizing, and consult certified financial advisors.
Stop Trading Without a Plan.
Build your intraday decisions around a defined framework for zones, direction, entry, risk and targets. Learn the strategy that brings institutional clarity to your trading journey.
REGISTER NOW